PRTG Manual: PRTG Probe Administrator
In the PRTG Probe Administrator program, you can define different system-oriented settings that affect your PRTG installation, as well as restart services and define the data storage location. Note: To get familiar with the different components of PRTG, we recommend reading the Architecture section.
Note: All settings made here are only valid for the local installation running on the computer you're opening the program on. In order to change settings for another installation, for example, another remote probe installation, please log in to this computer and open the program there.
From the PRTG Network Monitor group in Windows start menu, please select PRTG Probe Administrator to open the application. You can choose from these options in different tabs:
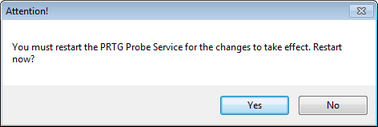
When closing the program using the Ok button, you are asked to restart the probe Windows service in order to save the settings. Please confirm by clicking the Yes button.
PRTG Probe Administrator
Define general settings regarding the probe and probe connections.
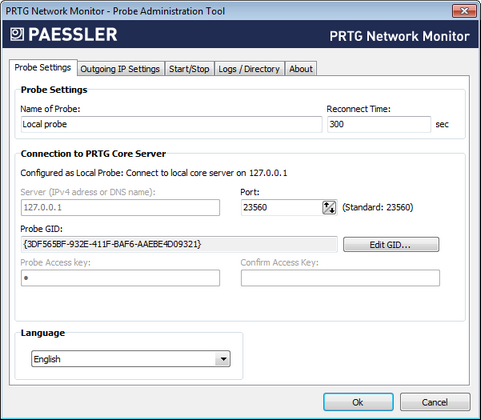
PRTG Probe Administrator (here: Local Probe on Core Server)
Probe Settings—Probe Settings
Name of Probe
- Enter a name for the probe. It will appear in the device tree in the web interface.
Reconnect Time
- Define the time that will be waited until the probe tries to reconnect to the core server in case the connection fails.
Probe Settings—Connection to PRTG Core Server
These settings will affect how the probe will connect to the core server. A probe is either a local probe or a remote probe. PRTG will automatically detect the type of probe and show the correct setting options.
When you opened this tool on the PRTG core server
- This probe is configured as the local probe of the PRTG core installation.
- It will connect to the core via 127.0.0.1.
- Define the Port number under which probe and core server will communicate. We recommend using the default value.
- The Probe GID is a unique identifier for the probe and should not be changed.
- No access key is needed for local probe connections.
When you opened this tool on a machine running a Remote Probe
- This probe is configured as remote probe.
- Enter the Server IP address or DNS name and the port for the connection to the core server.
- Define the Port number under which probe and core server will communicate. We recommend using the default value.
- The Probe GID is a unique identifier for the probe and should not be changed. Except when substituting an existing probe, you must change it to the old probe's GID. To do so, click on the Edit GID... button and confirm the warning with Yes. You can then change the value.
- The Probe Access key must match one of the access keys configured in your PRTG core server installation. If it doesn't, the remote probe will not be able to connect to the core server. Please see System Administration—Probes (Probe Connection Settings) section for more information. Note: Also check the allowed and denied IPs there to make sure the core server accepts the IP address of the remote probe.
Probe Settings—Language
- Choose the language for this program from the drop down menu. Default is English. Depending on your installation, you may be able to choose other languages here.
Define the IP address used for outgoing monitoring requests.
- If there is more than one IP on the current system available, you can specify the IP address that will be used for outgoing monitoring requests of certain sensor types.
- The setting is valid for all monitoring requests sent from this PRTG probe.
- This setting will be used for sensors using the following connection types: HTTP, DNS, FTP, IMAP, POP3, Port, Remote Desktop, SMTP, and SNMP.
- This is useful for devices that expect a certain IP address when queried.
- Default setting is auto. PRTG will select an IP address automatically.
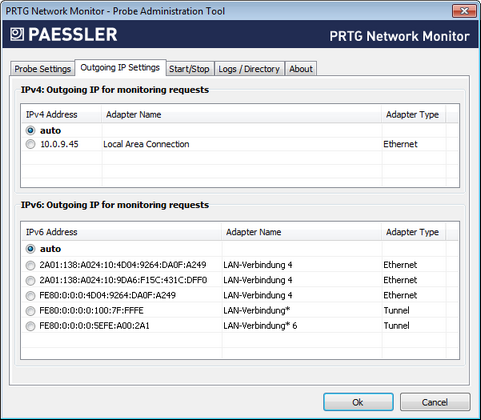
PRTG Probe Administrator Outgoing IP Settings
Outgoing IP Settings—IPv4: Outgoing IP for Monitoring Requests
Define the IP address for outgoing requests using the IPv4 protocol. The list shows all IP addresses available on the current system. Choose a specific IP address or select auto.
Outgoing IP Settings—IPv6: Outgoing IP for Monitoring Requests
Define the IP address for outgoing requests using the IPv6 protocol. The list shows all IP addresses available on the current system. Choose a specific IP address or select auto. For details about the basic concept of IPv6 in PRTG, please see IPv6 section.
Start or stop the probe Windows service and schedule system restarts.
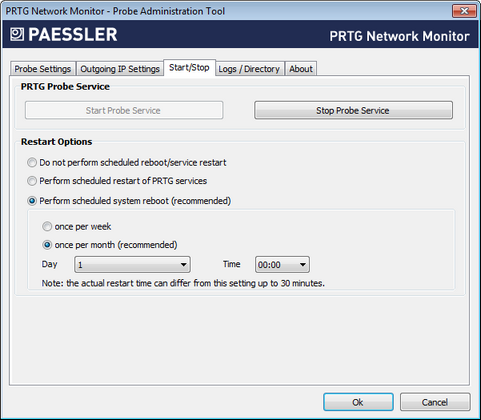
PRTG Probe Administrator
Start/Stop—PRTG Probe Service
You can stop and start the probe Windows service manually. Click the Stop Probe Service button to stop the service, and Start Probe Service to start it again. Both actions usually take from a few seconds up to several minutes to complete.
Start/Stop—Restart Options
For best performance we recommend to restart the Windows servers PRTG is running on from time to time. In order for PRTG to do this automatically you can schedule an automatic reboot. There are the following options:
Do not perform scheduled reboot/service restart
- Do not perform any scheduled reboot or restart of services automatically.
- We recommend a manual restart every few weeks.
Perform scheduled restart of PRTG services
- Restart both core server and probe service.
- Please enter a schedule below.
Perform scheduled system reboot (recommended)
- This is the recommended setting, although not set by default.
- Please enter a schedule below.
- We recommend restarting Windows servers once a month for best performance.
[Schedule]
When scheduling an automatic service restart or reboot, define a schedule. The options are:
- Once per Week: Select a weekday and time below.
- Once per Month: Select a day of month and time below. When selecting Last, the report will always run on the last day of the month, regardless of how many days the month has. When selecting a date that does not exist in every month, e.g. the 30th in May, PRTG will automatically run the report on the last day of this month.
Note: A Windows warning message will be displayed 10 minutes before reboot to inform a logged in user. The actual restart time can differ up to 30 minutes from the settings entered here!
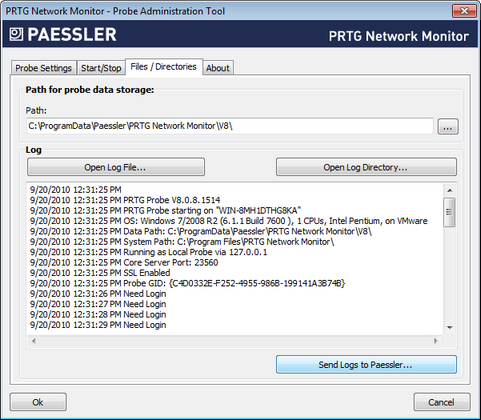
PRTG Probe Administrator
Path for probe data storage
- Note: This setting is relevant merely for probe only installations, for example, when running a remote probe on the system. For an installation of PRTG core server and probe, i.e. a full PRTG installation, the path setting in this window is overridden by the path defined in the settings of PRTG Server Administrator.
- Define the data folder to which PRTG will store configuration and monitoring data. Note: Before changing the path, make sure you stop both services and copy all data to the new location.
Log
You can view the log of your PRTG probe. The following buttons are available:
- Open Log File...
Directly view the content of the probe system log. Depending on the number of entries, it may take a few seconds until the logs are shown. - Open Log Directory...
Open the log file directory on your hard disk drive. - Send Logs to Paessler...
Open an assistant to send log files to the Paessler support team. Please see below.
Logs / Directory—Send Logs to Paessler
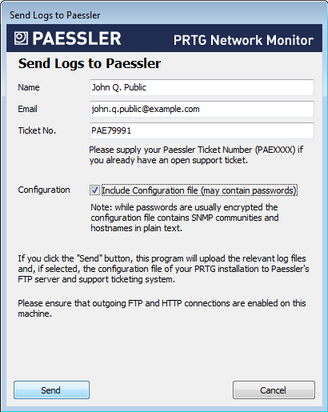
Send Logs to Paessler
When opening a support ticket, Paessler support may ask you to send log files for further analysis. Using the Send Logs to Paessler... button, PRTG will automatically collect, compress and send your log files. Note: This button is available when using a commercial license only.
Name
- Please enter your name.
- Please enter your valid email address.
Ticket No.
- This field is optional.
- If you have already opened a ticket at Paessler support, please provide the ticket number you received. Your files will then be associated with your ticket automatically.
- Please enter the ticket number starting with PAE followed by four or more digits.
- If you do not have a ticket number, please leave the field empty. Note: You should usually contact the support team before sending any files.
Configuration
- Define if your configuration file will be included in the data. Passwords are usually encrypted, but there may be some passwords stored as plain text.
Shortened
- Define if your log files will be shortened (this is the default setting). Sometimes we will ask you to send full log files. In this case, please uncheck this box.
Click on the Send button to start data upload. Please make sure FTP and HTTP connections are allowed on this machine.
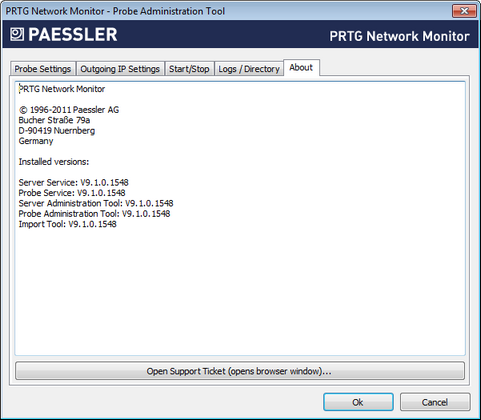
PRTG Probe Administrator
Displays version information for installed PRTG programs. Click on the Open Support Ticket button to ask the Paessler support team for help. This will open a new web browser window.
Keywords: Configure,Configure Probe,Configure Reboot (automatic),Automatic,Automatic Restart Options (Probe System),Restart Options (Probe System),Scheduled Reboot (Probe System),Probe Administrator
