PRTG Manual: Reports
Reports are used to analyze historic monitoring results over a specified time such as one or more days, one month, or an entire year. You can create reports for all, or only for certain sensors.
PRTG includes a powerful reporting engine for ad-hoc, as well as scheduled report generation in HTML and PDF format. Thus, reports can be run on demand or on a regular basis (e.g. once a day). You can create reports for one single sensor, or you choose a range of sensors you want to create a report for. The content and layout of the report is controlled by the report template of your choice and is the same for all sensors in a report.

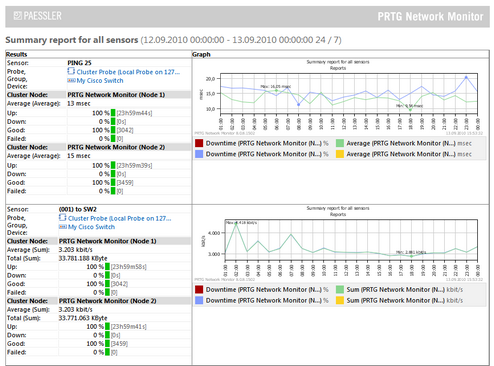
Report Sample
The sample above shows a report for a router device. You can see graphs for the last day, plus data tables with numeric results.
Click the Reports entry from the main menu to view or add reports of your monitoring data. Hover to show other menu items. Choose between:
- All
Calls the Reports feature where you can view or add reports of your monitoring data. - Add Report
Lets you directly add a new report. - Select Report ›
Show existing reports. Hover to show other menu items. Follow the menu path (it is specific to your setup) to select a report.

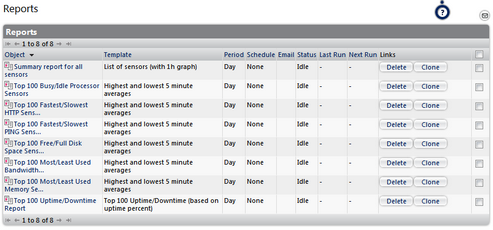
List of Reports
In the All view, you see a list of all existing reports. Every line shows information about one report:
- Period: The time span covered by the report.
- Schedule: Shows if a schedule is set to regularly execute the report automatically.
- Email: If a schedule and an email address is set in the report settings, this shows the email address the report is automatically sent to.
- Last Run: If a schedule is set in the report settings, this shows when the report was last run.
- Next Run: If a schedule is set in the report settings, this shows when the report will be run next.
Using the Delete link at the end of a line you can delete the report.
Please see also Working with Table Lists. Additionally, there is multi-edit available. This enables you to change properties of several objects at a time. For more details, please see Multi-Edit Lists section.
Click on the Add Report button to add a new report, or click on the name of an existing report to view and edit its settings. You can also run a pre-configured report easily by clicking on its name and then using the options in the Run Now tab. For both options, please see Reports Step By Step section.
For detailed information on how to create, edit, and schedule reports, please see the following sections:
For performance reasons, PRTG automatically averages monitoring data when calculating data for large time spans. Data is then averaged regardless of the selected average interval.
Time Span in Report |
Minimum Level of Detail (Average Interval) |
Up to 40 days |
Any |
40 to 500 days |
60 minutes/1 hour or larger |
A report for a time span of more than 500 days is not possible. If you try to set a larger time span, it will be reduced to 365 days automatically.
Ajax Web Interface—Advanced Procedures—Topics
Other Ajax Web Interface Sections
Related Topics |
|---|
Keywords: Averaging,Percentiles,Configure,Configure Report,Reports
