PRTG Manual: Libraries
With PRTG's Libraries feature you can create special views of your device tree with up-to-the-minute monitoring status information, arranged the way you want it.

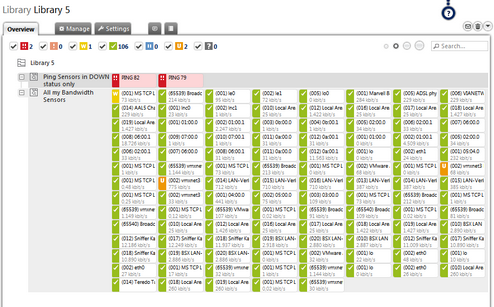
Example of a Library
In this section:
Libraries is a powerful feature which enables you to create additional views of your device tree, which are updated with the same scanning interval as your device tree, showing the same monitoring data, but arranged in a way you want it. This is interesting if you want to show data in different ways, e.g. depending on target groups or use case. For example, you can create a library which contains an overview of all your bandwidth monitoring sensors, regardless of which device they're running on.
Library features include:
- Create libraries containing nodes with monitoring objects from all over your configuration
- Show data from different PRTG probes in one library
- Show different branches of your device tree right next to each other
- Arrange sensors in a tree-like view regardless of which device they are running on
- Filter your entire tree (or parts of it) for sensor type, state, or tag, showing only matching sensors
You can create libraries easily, using drag&drop right within your browser.
PRTG comes with several pre-configured standard libraries, which you can use right away. You can also change or delete them, if you like. The following libraries are automatically created when you install PRTG for the first time (visible for the PRTG Administrator user). Some of them will be initially empty, but as you add more sensors, they will be filled automatically according to the filter settings defined for the nodes of the libraries:
- All bandwidth sensors
- All CPU load sensors
- All diskspace sensors
- All memory sensors
- All VMware sensors
- Sensors grouped by priority
- Sensors grouped by state
Note: Sensors which are added to libraries are not counted against the maximum number of sensors of your license.
Click the Libraries entry from the main menu to view or add custom views of your network's status and monitoring data. Hover to show other menu items. Choose between:
- All
Calls the Libraries feature where you can view or add custom device tree views of your network's status and monitoring data. - Add Library
Lets you directly add a new library. - Select Library ›
Show existing libraries. Hover to show other menu items. Follow the menu path (it is specific to your setup) to select a library.
In the All view, you see a list of all existing libraries. Using the links next to a library name, you can perform the following actions.
- Click on the name of a library to view it.
- Delete: Delete this library.
- Used by: Show which other monitoring objects use this library.
- Click on the Add Library button to add a new library.
Please see also Working with Table Lists. Additionally, there is multi-edit available. This enables you to change properties of several objects at a time. For more details, please see Multi-Edit Lists section.
For detailed information on how to create and edit libraries please see the following sections.
Ajax Web Interface—Advanced Procedures—Topics
Other Ajax Web Interface Sections
Related Topics |
|---|
Keywords: Libraries
